
Commodities Chart
Historical commodity charts for energy, metals and agriculture
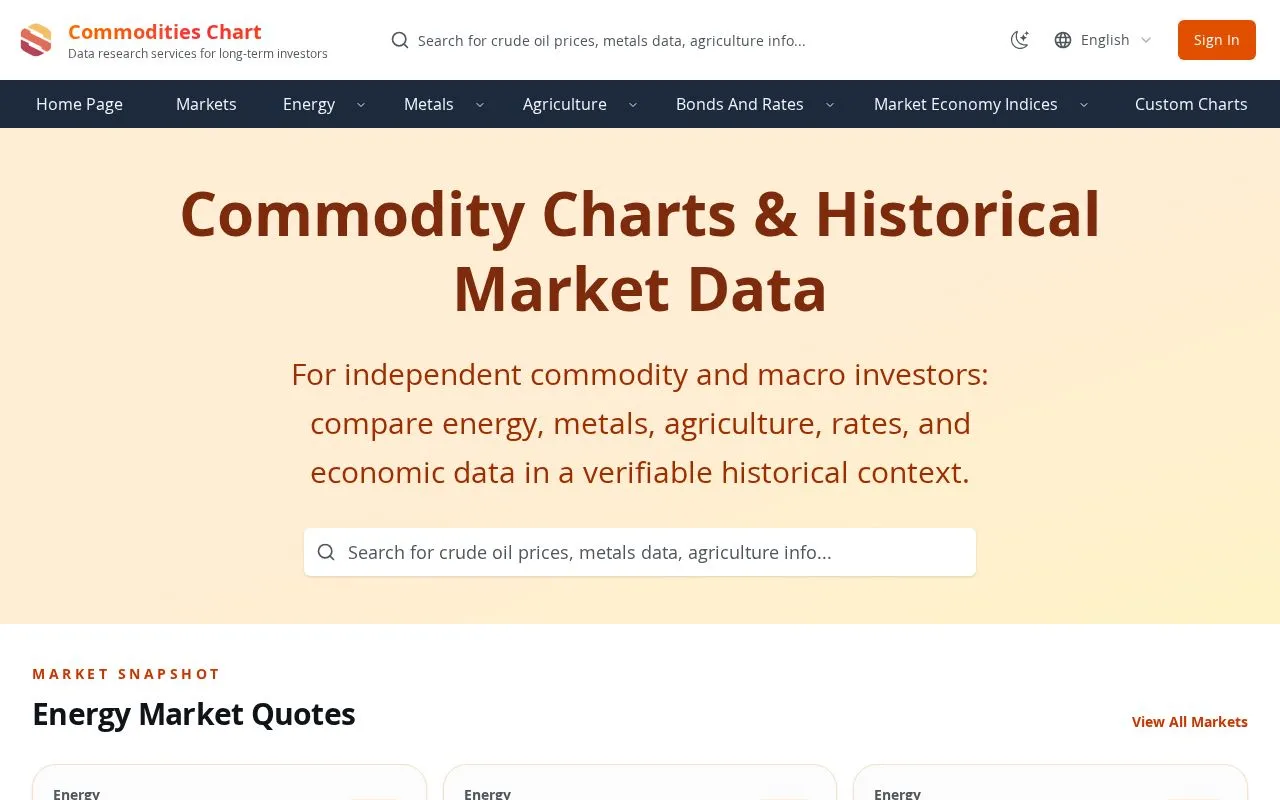
About Commodities Chart
Commodities Chart is a research platform for independent commodity and macro investors who want to study energy, metals, agriculture and rates data in historical context. It offers charts for benchmarks such as WTI, Brent, natural gas, copper, gold, silver and soybeans, alongside bond rates and market economy indices.
The site emphasizes verifiable research. Each series shows its units, observation dates and data source, and it provides historical percentiles and long-run averages to help place current values in perspective. Users can also build custom charts after signing in to save a workspace.
The platform states clearly that it is not a live quote service and not investment advice. Inventory charts measure stored volumes rather than prices, and the site explains the differences between spot and futures data for readers who compare markets.
Related tools
Commodities Chart alternatives
Global Data Tracker
World statistics and country data with sources for each figure

OwlInsight
A simpler dashboard for your existing GA4 data

VisitTrack
Web analytics that ties every sale to its source

DATA HIT Tools
Free GA4, Search Console and AI answer visibility tools

Jolene.pro
Ask questions of Excel and CSV files, get cited answers

Clics
Cookieless web analytics you can query through AI tools